
Kubernetes logs are useful only when you know which container produced the line. A message from a Pod with the right name in the wrong namespace can send an investigation in the wrong direction; the same message from another cluster can be a different incident altogether. A useful desktop log view should keep the source attached while still making a busy stream readable.
Vastanex Log Explorer starts from an exact Pod container. Each record carries its cluster context, namespace, Pod and container identity, along with the parsed level and the raw line. The friendly controls sit around that identity instead of replacing it.
Filter the records you actually need
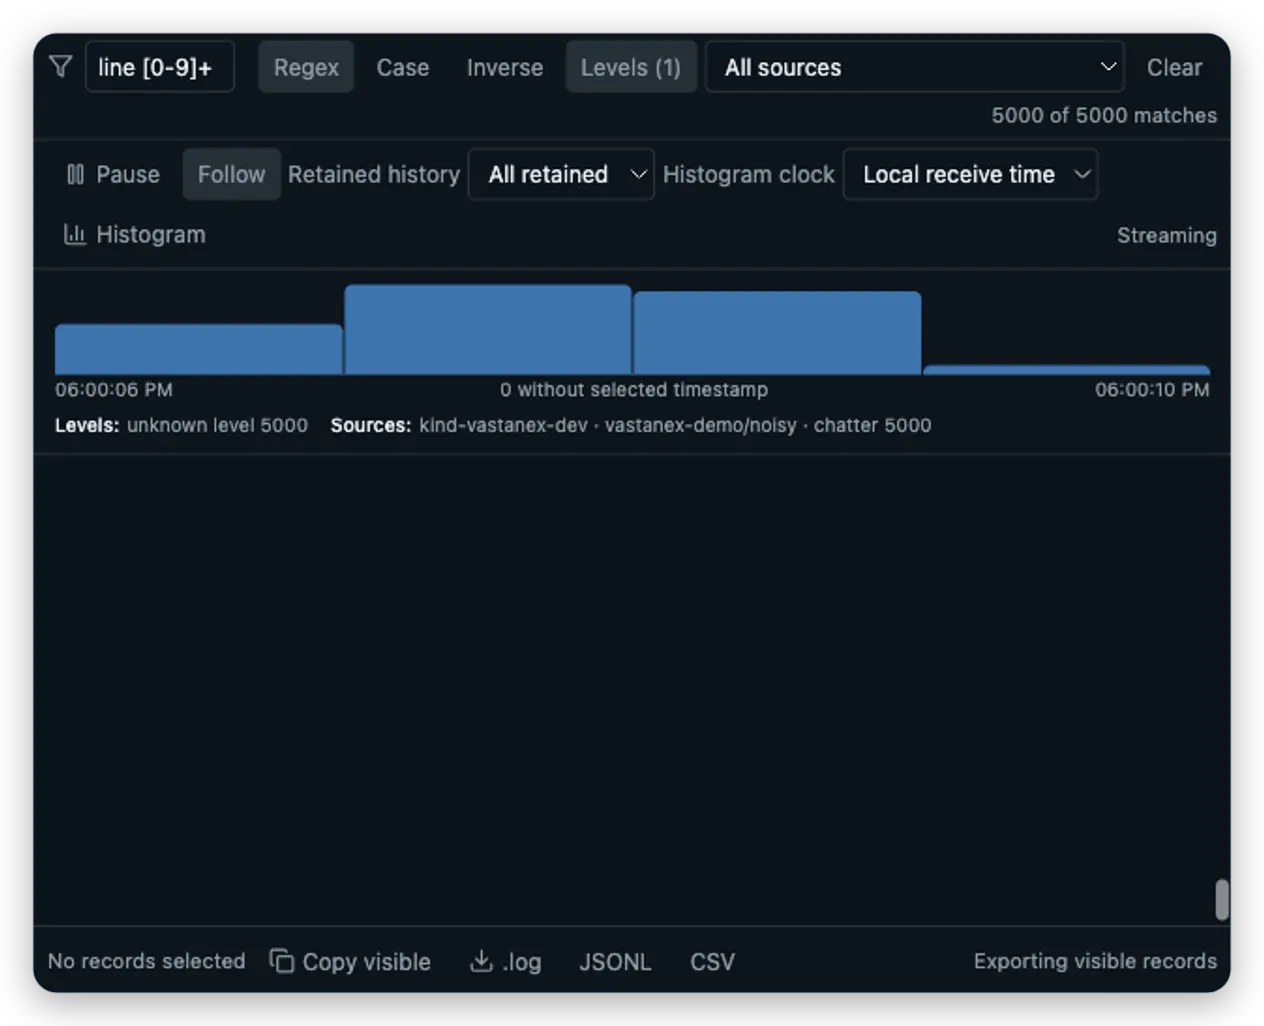
The Explorer has one bounded filter bar for text, case sensitivity, inverse matches, levels and
source. Plain text is the quick path. Regex is available when a pattern is more useful than one
literal word, but an invalid or unsafe expression fails closed rather than turning into an
unbounded search. The screenshot uses a regex for the numbered lines in the local noisy Pod.
The filter is applied to structured records, not to an unrelated copy of the terminal. A result
can still show the raw line, received time, source sequence and parsed level. If a parser cannot
reliably identify a level, it stays unknown; the interface does not silently promote an uncertain
value into info or error.
At the top of the view, a match count makes the scope of the current result visible. Clear the filter to return to the retained records. The list is virtualized, so a large local buffer does not require rendering every row at once.
Pause a live view and read its shape
Pause freezes the displayed records while the bounded source buffer continues to have an explicit lifecycle. Follow keeps the view near the newest displayed record when that is what you want. The retained-history selector can narrow the view to the last minute or hour, and the histogram shows how the retained records are distributed across the selected time range.
The histogram clock is labelled. A single stream can use local receive time or the Kubernetes timestamp when one is present. A missing timestamp remains missing. That distinction matters when a record arrived late or when the source’s clock is not trustworthy.
The level and source breakdowns are summaries of what is still in the local bounded view. They help answer “what kind of records are here?” without implying that the app has reconstructed a central logging system or a complete incident timeline.
Export the evidence that is still present
The footer can copy visible records and export .log, JSONL or CSV. If you select records, the
export names that selection; otherwise it exports the visible filtered set. JSONL preserves one
structured record per line, while CSV makes a small slice easy to inspect elsewhere. The export
buttons are part of the same bounded surface as the filter and histogram, so the selected source
and current view remain clear before saving.
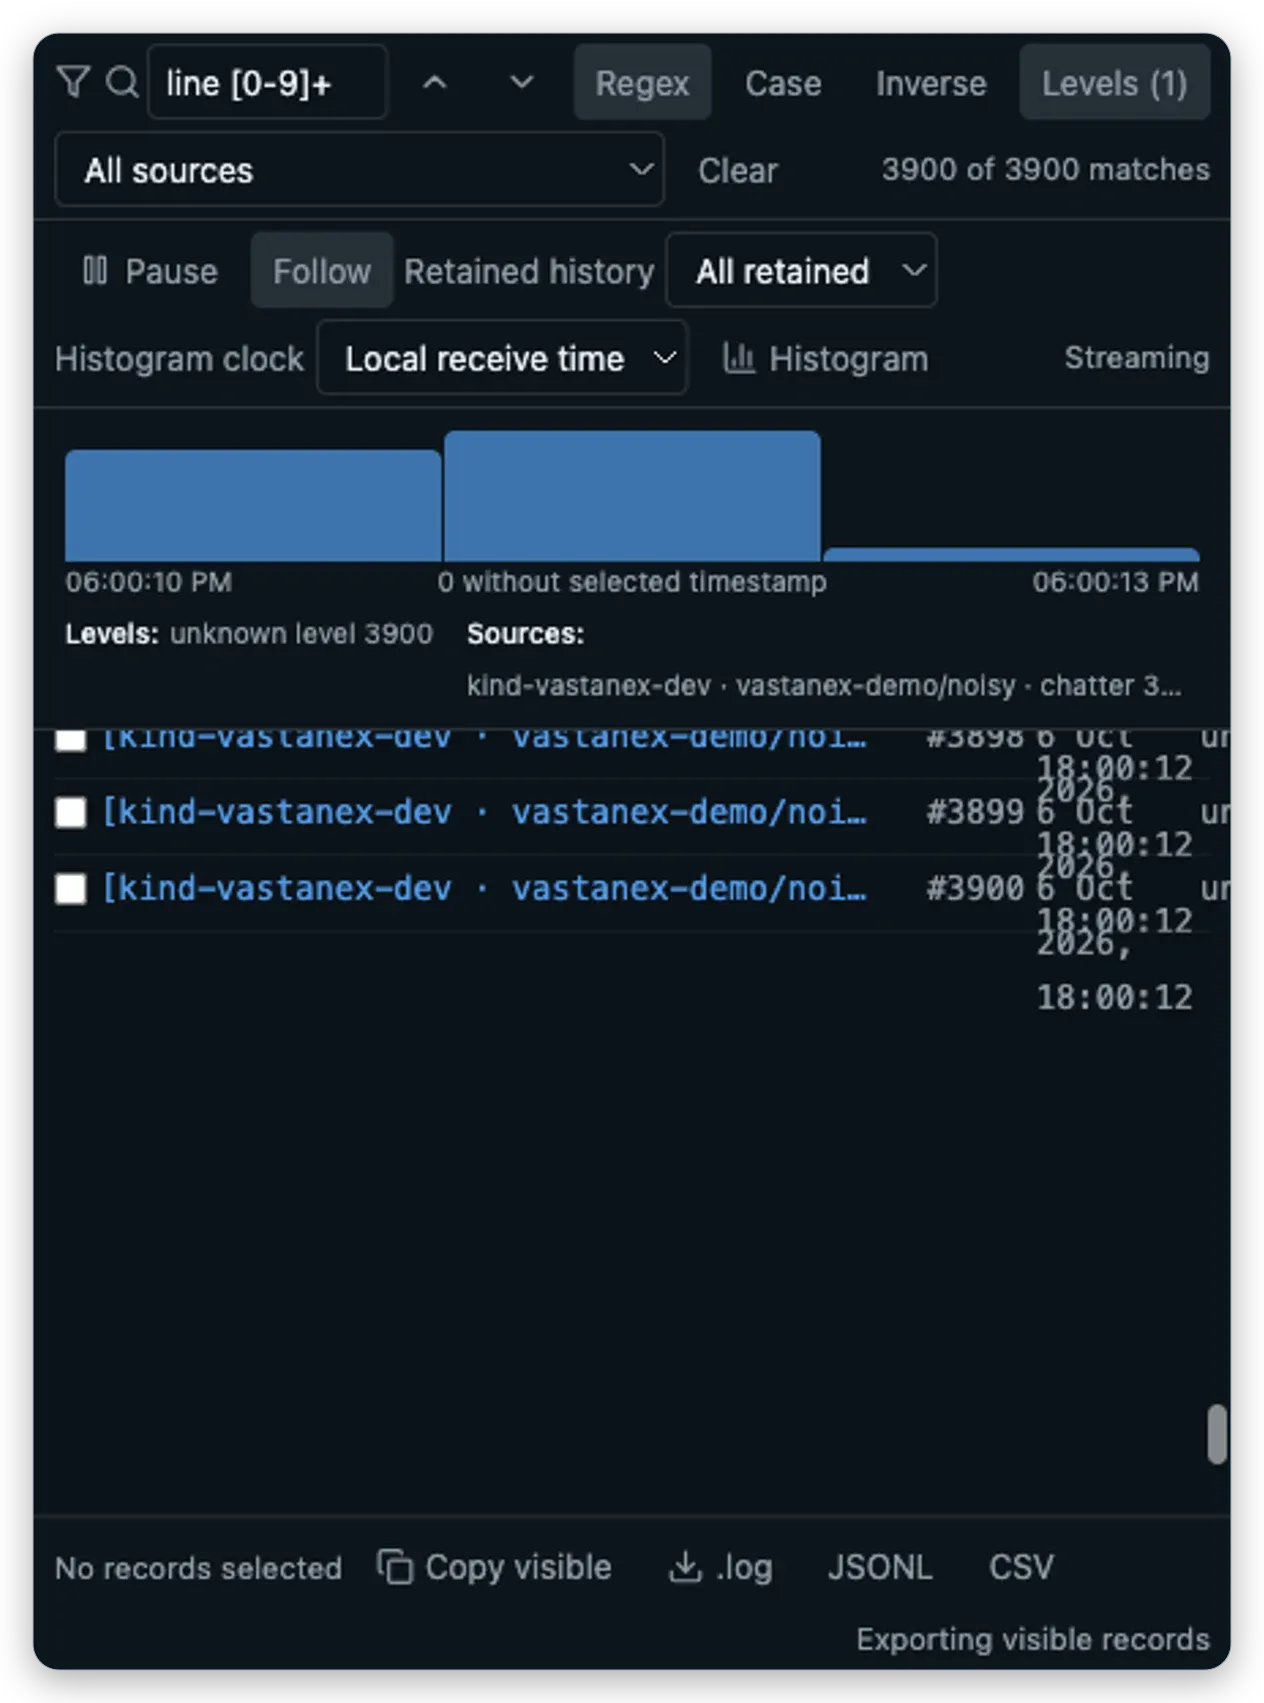
The buffer has limits. Vastanex retains at most 6,000 records in the Explorer, reports dropped older lines and marks partial, malformed or truncated records when those conditions are known. Saving the visible slice is not the same as preserving lossless history. A production incident still needs the logging system that owns long-term retention. The Kubernetes logging documentation explains the cluster-level systems that sit beyond a Pod’s own stream.
Compare sources without inventing one clock
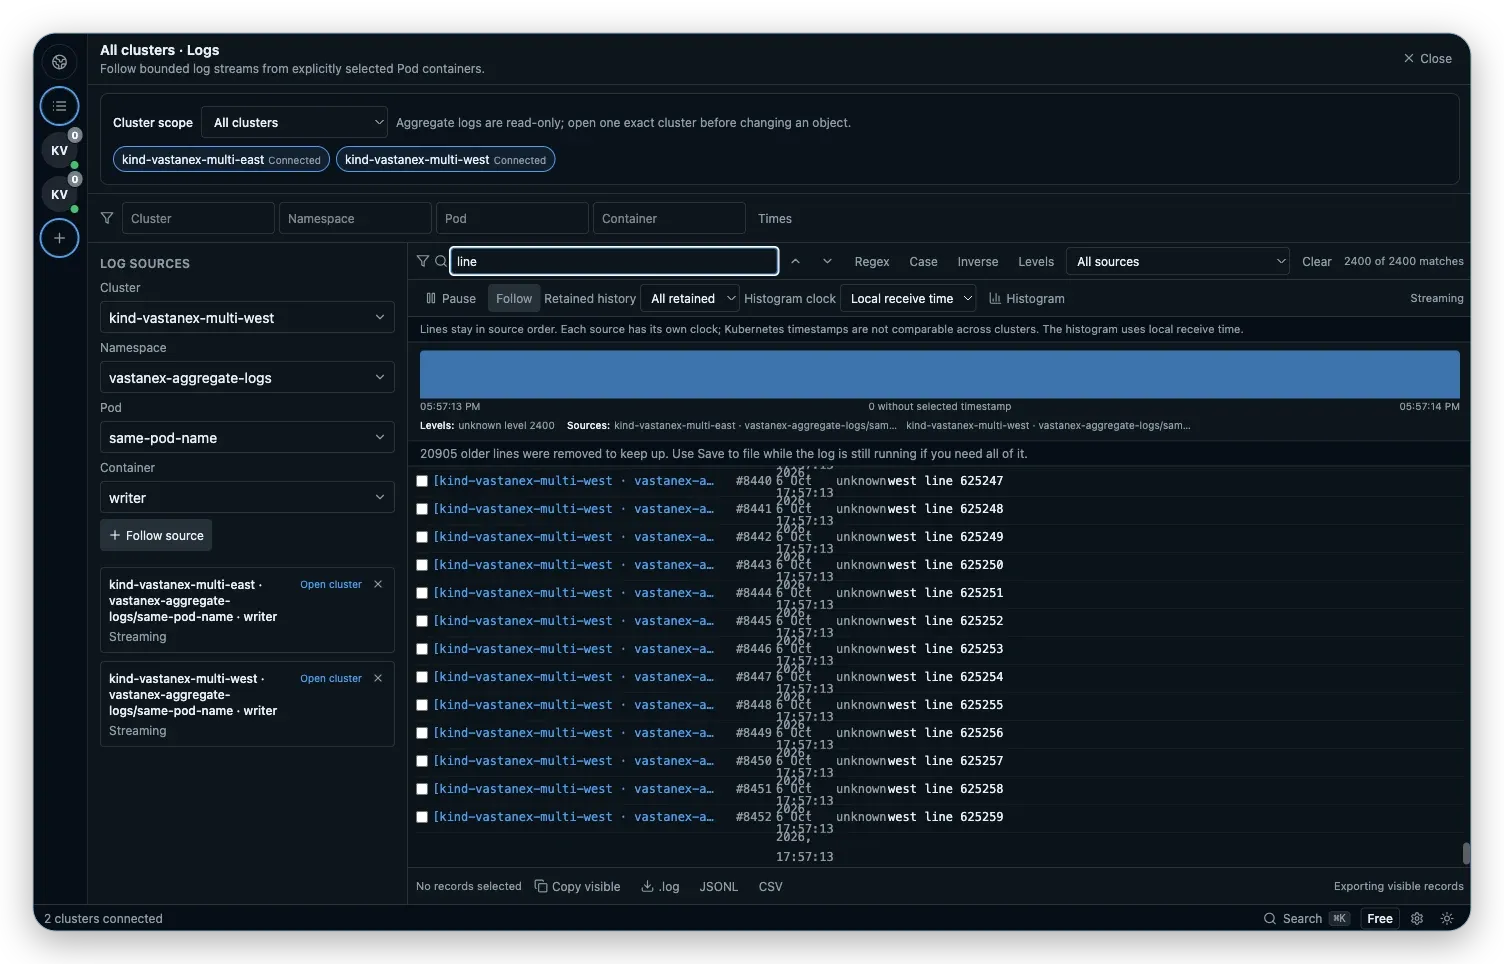
The aggregate Logs view follows explicitly selected Pod containers from more than one connected cluster. It keeps a source label beside each record, limits the number of concurrent sources and explains that source clocks are not comparable. The histogram there uses local receive time, and the view preserves source order rather than claiming one cross-cluster chronology.
What it does not do
Log Explorer is not a hosted logging backend, a lossless archive or an automatic diagnosis engine. It does not infer a root cause from a matching line, merge unrelated sources into one trustworthy timeline or make an unavailable stream look healthy. Export is bounded to the records still in the current view. Aggregate Logs remains read-only; a change always returns to one exact cluster and the normal permission gates.
Try the Download page to see the current desktop availability, then read how Vastanex starts with the Problem that needs attention or keeps multiple cluster sources attached.