
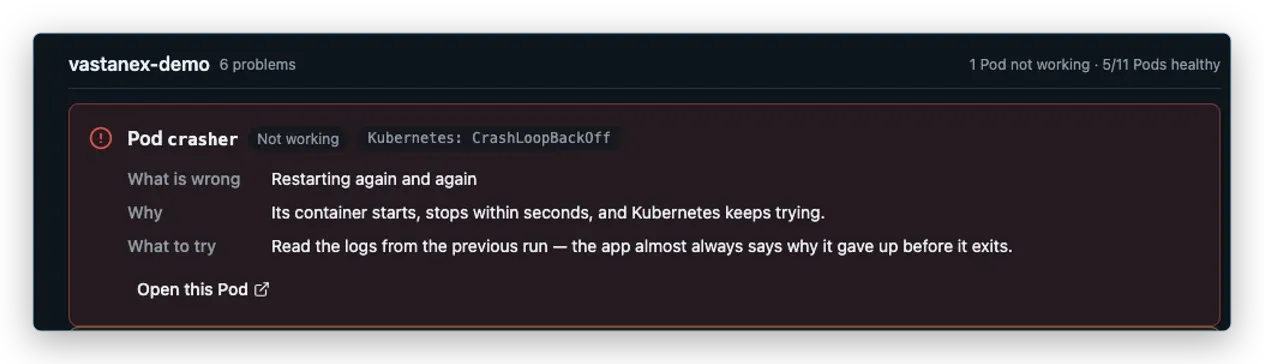
When a Kubernetes Pod keeps starting and stopping, CrashLoopBackOff is an alarming status to see. It is also easy to read too much into it. The status tells you that Kubernetes is backing off repeated restart attempts; it does not identify the application bug by itself.
The Kubernetes Pod lifecycle documentation explains the distinction: a Pod has a phase, while each container can be Waiting, Running or Terminated. CrashLoopBackOff can appear as a display status when a container keeps failing and restarting. Treat it as a starting signal, then gather evidence around the same object.
Start with the Problem
Vastanex puts actionable conditions in Problems instead of making you guess which resource list to open. The card keeps the Pod name, the friendly explanation, the raw Kubernetes status and What to try together. Search and namespace filters help narrow the bounded result set, and opening the card carries the exact object identity into the next view.
The useful question here is not “Has the app diagnosed the bug?” It is “What should I verify next?” For a crash-looping Pod, that might be the previous container’s logs, a configuration value, a probe, an image or a resource limit. The suggested step is operator guidance, not an automatic action.
Follow the same Pod into Events and details
Open the Problem and inspect the detail drawer. The drawer follows the live object rather than showing a frozen screenshot, and its Events section is scoped to that object. A real BackOff event says that Kubernetes has been backing off restart attempts. That is useful evidence about this Pod, but it still does not prove why the process exits.
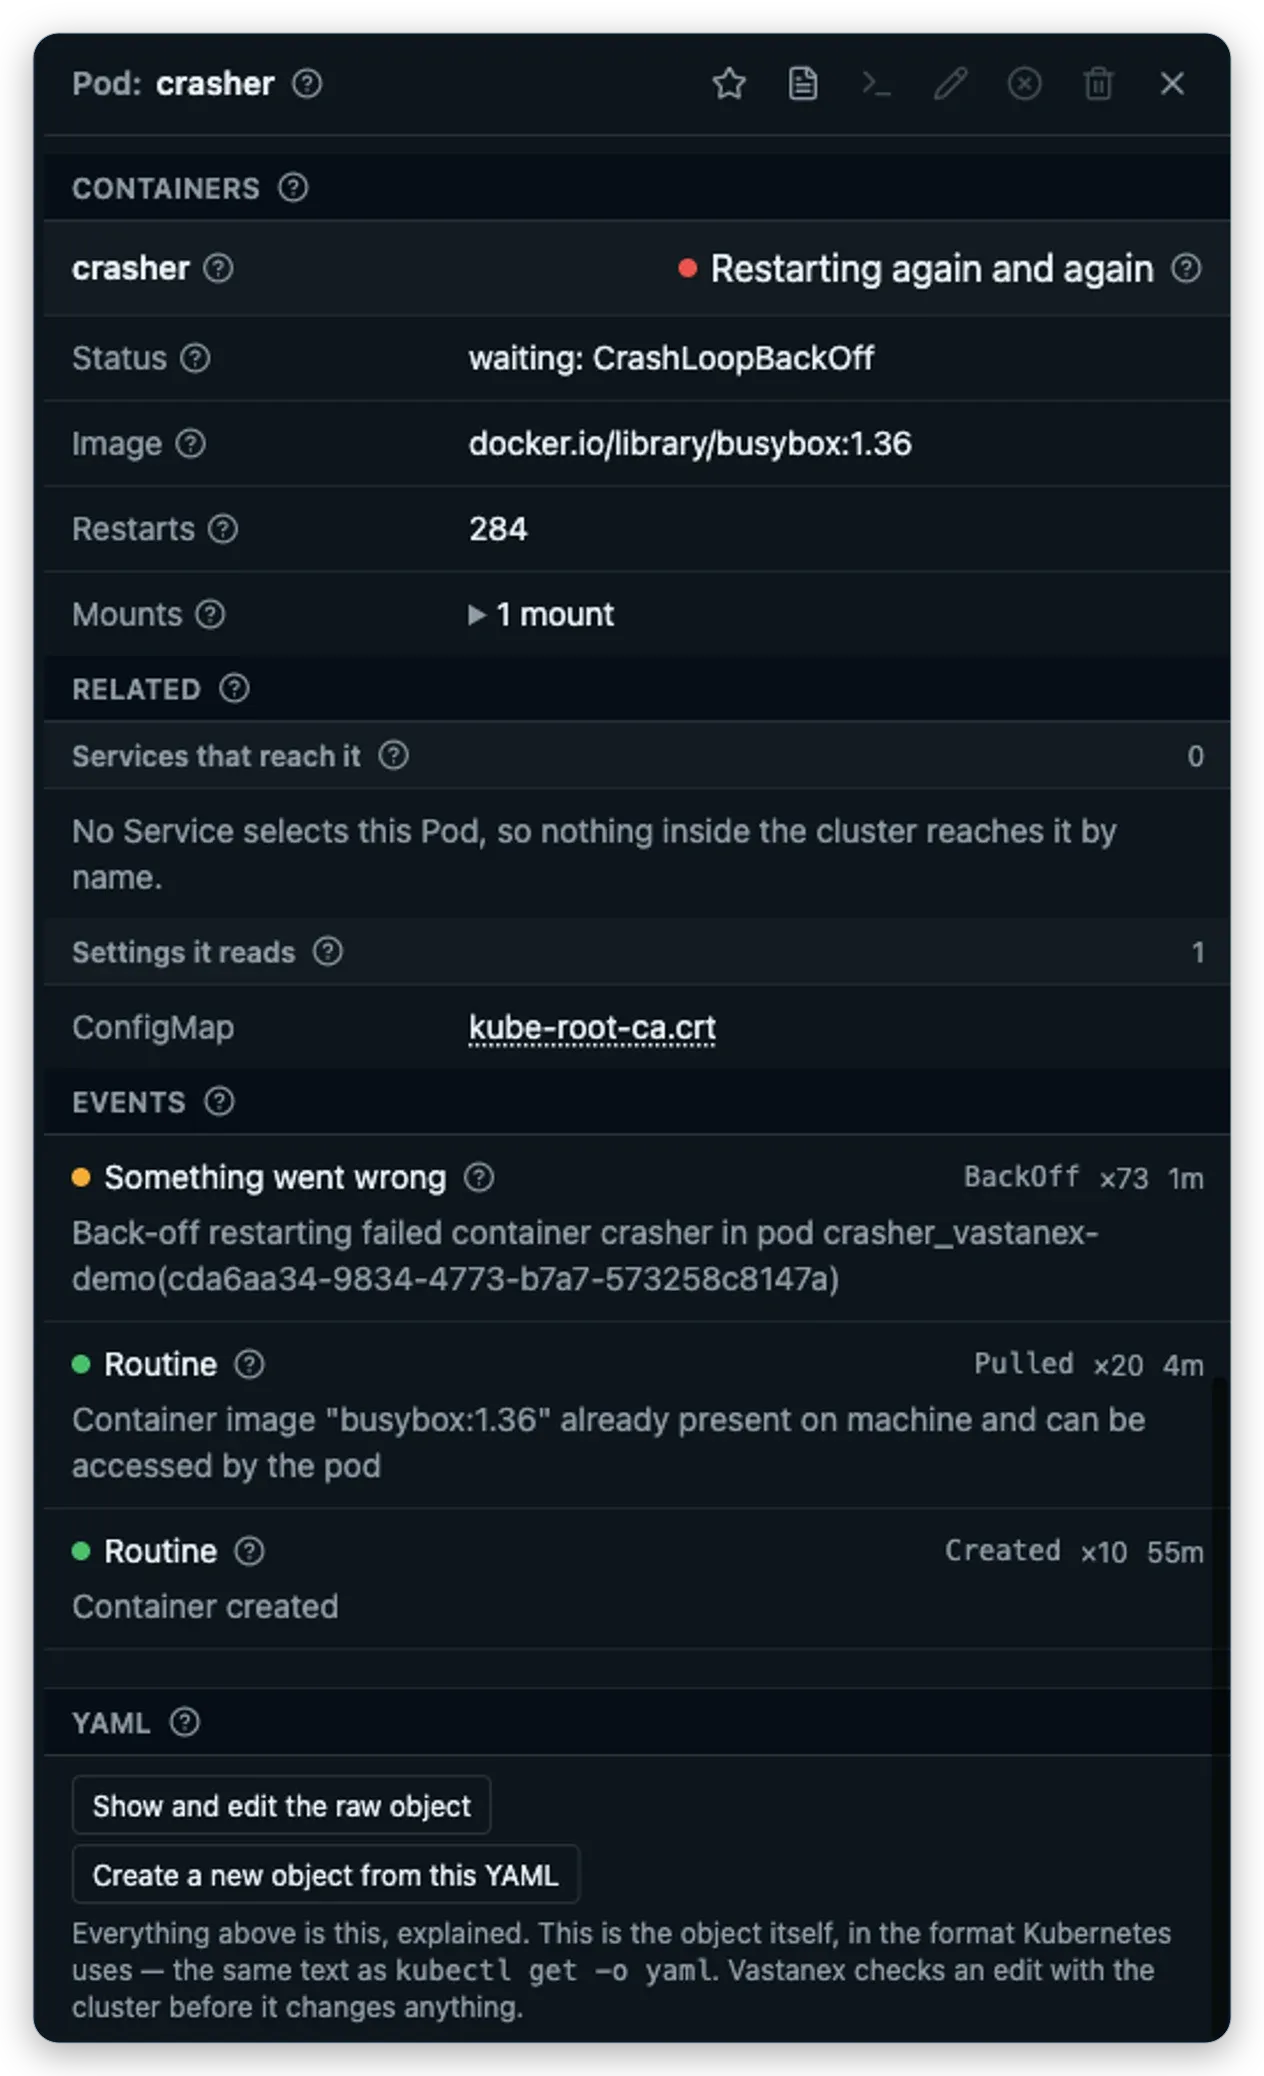
The bare crasher Pod in this example has no controller owner. Keep that identity separate from the web Deployment used for the app’s guarded-action example. If you prefer a terminal check, the equivalent read-only Kubernetes investigation is kubectl describe pod <name> -n <namespace>, followed by the relevant Events and status fields. Vastanex uses the Kubernetes API for its own views; it does not secretly shell out to kubectl.
Read logs with the source attached
Logs are often the next piece of evidence. Open the log stream from the selected object so the Pod, namespace and container stay attached to the investigation. The Log Explorer keeps source identity visible, separates Pause from Follow, supports text and bounded regex filtering, and makes retained history, partial lines and dropped records explicit.
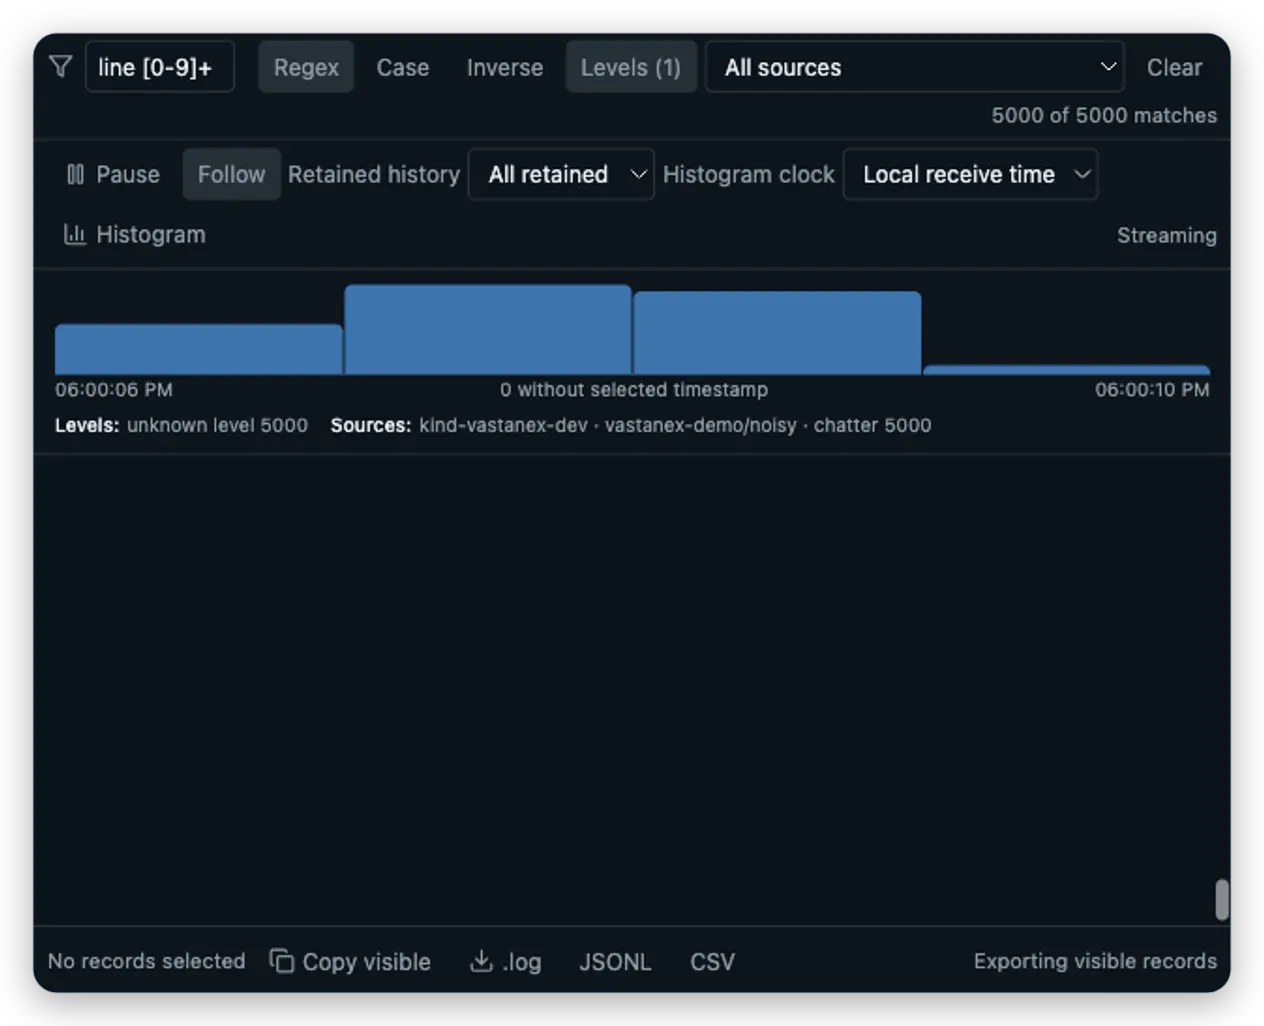
The accepted image above uses the noisy fixture to show the Explorer controls. It demonstrates streaming and bounded investigation; it is not a diagnosis of the crasher Pod. For a failing container, a terminal equivalent might be kubectl logs <name> -n <namespace> --previous when a previous container exists. Compare what the process printed with the Events and the current container state. A log line is evidence from one process, not a complete explanation of the cluster.
Add metrics only as context
If a supported metrics provider is available, Capacity can put usage, requests, limits and allocatable Node capacity beside operational signals. A restart, an OOMKilled event or a high reading can coincide with a failure and help choose the next check. It does not become a root cause automatically.
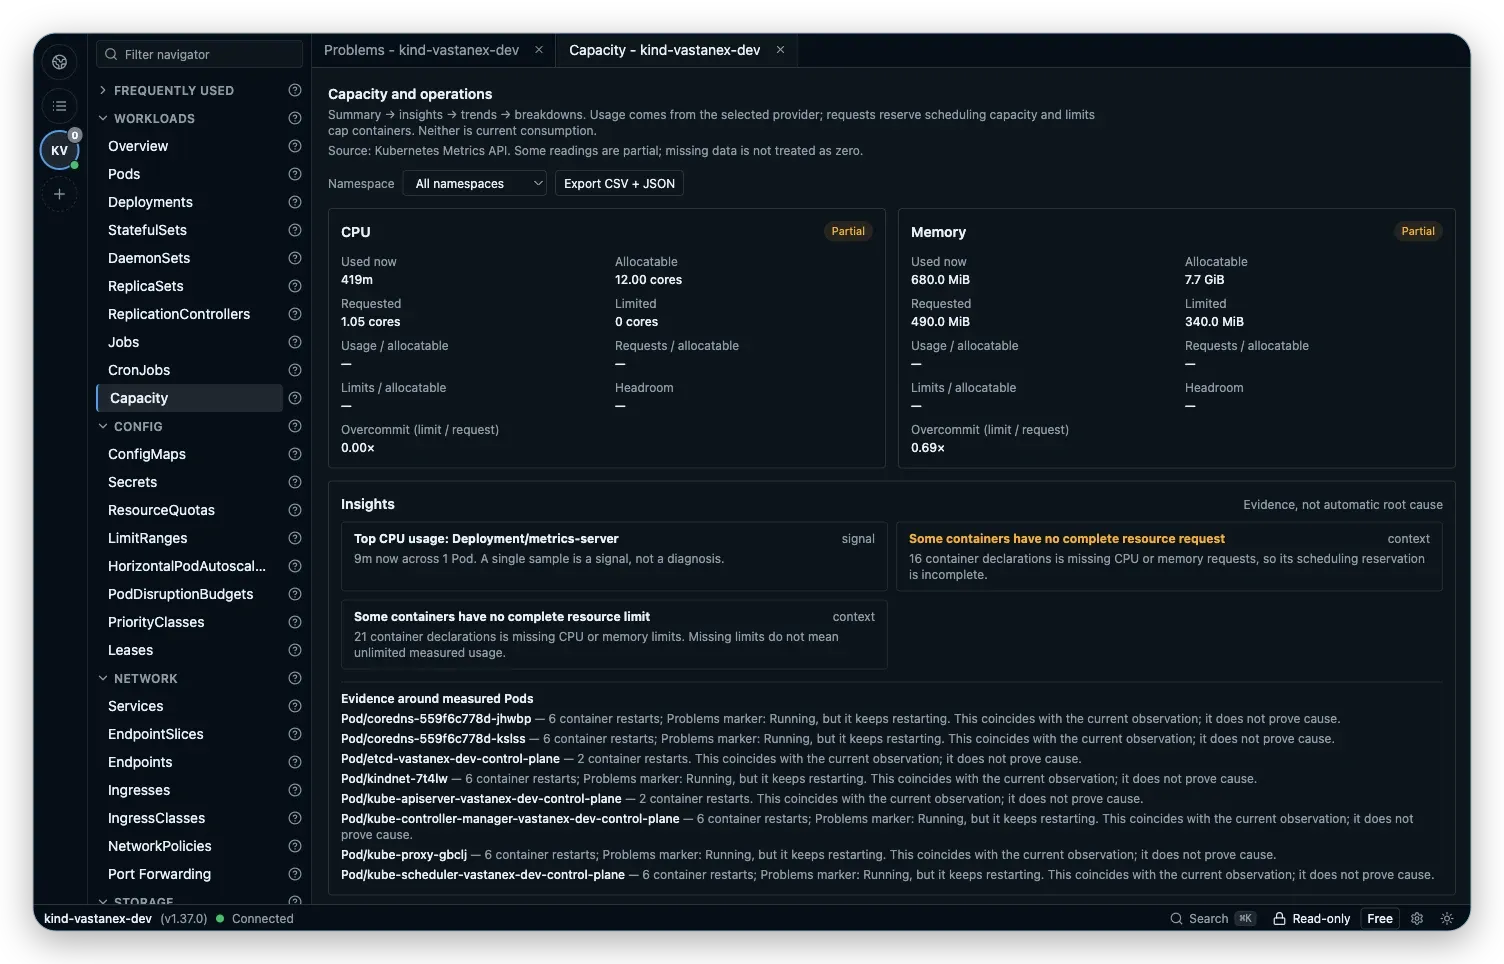
Metrics may be missing, partial, stale or forbidden by RBAC. The local fixture used for this proof has no supported cost provider, and the app keeps that unavailable state visible instead of inventing a price or saving. Missing evidence is a reason to qualify the conclusion, not a reason to call the Pod healthy.
Choose the next verification step
Use the signals together, then verify the most plausible boundary:
- If the previous log ends with an application error, inspect the image, configuration and application change that introduced it.
- If Events mention an image or registry, verify the image name, tag and the permissions needed to pull it.
- If a probe is failing, inspect its command, path, port, startup timing and the process’s actual listening behavior.
- If the Pod cannot schedule or stays short of resources, compare requests and limits with Node capacity and scheduling conditions.
- If configuration is missing, check the referenced ConfigMaps, Secrets and mounted files without exposing Secret bodies.
The Kubernetes documentation is a useful source for the container-state and restart-policy vocabulary. Your cluster’s workload, image, probes and permissions still determine which explanation fits.
What it does not do
This workflow is not automatic root-cause analysis and it does not promise to repair a failing Pod. Vastanex detects a bounded set of actionable conditions, shows the evidence it can read and keeps partial or unavailable sources labelled. It does not promise that every workload failure will produce a useful Problem, that metrics will be installed, or that one Event, log line or measurement is conclusive.
The crasher scene is a real local-kind fixture, not a production incident. Its BackOff event proves what Kubernetes recorded for that object. The right next step remains a decision for the operator who owns the workload.
Start with the Problems-first workflow for the plain-language overview, or download the desktop app to investigate a cluster with the same problem-to-evidence order.